
For SBA & business acquisition lenders
Know what you're lending against.
Valuation + Quality of Earnings, built for SBA acquisitions.
01SBA-ready
Valuation + QoE built for SBA acquisition lending
02NACVA-certified expertise
Credentialed business valuation professionals
03PDF + API
Lender-ready reports and structured data delivery
$172M+
Business value analyzed
66
Private businesses analyzed
$97M
Lending exposure represented
Valuation + QoE
Built for acquisition underwriting
SBA SOP 50 10 8.1
Acquisition diligence just changed.
SBA's updated change-of-ownership framework places greater emphasis on documented historical earnings, transaction-specific acquisition analysis, and Quality of Earnings for qualifying transactions.
Quality of Earnings
Independent QoE is now part of the diligence framework for qualifying acquisition and expansion transactions.
Historical earnings
Normalization and support for historical cash flow matter.
Defensible evidence
The lender needs a clear record of the information and analysis relied on in underwriting.
Lenders should rely on the applicable SBA SOP and notices for transaction-specific requirements.
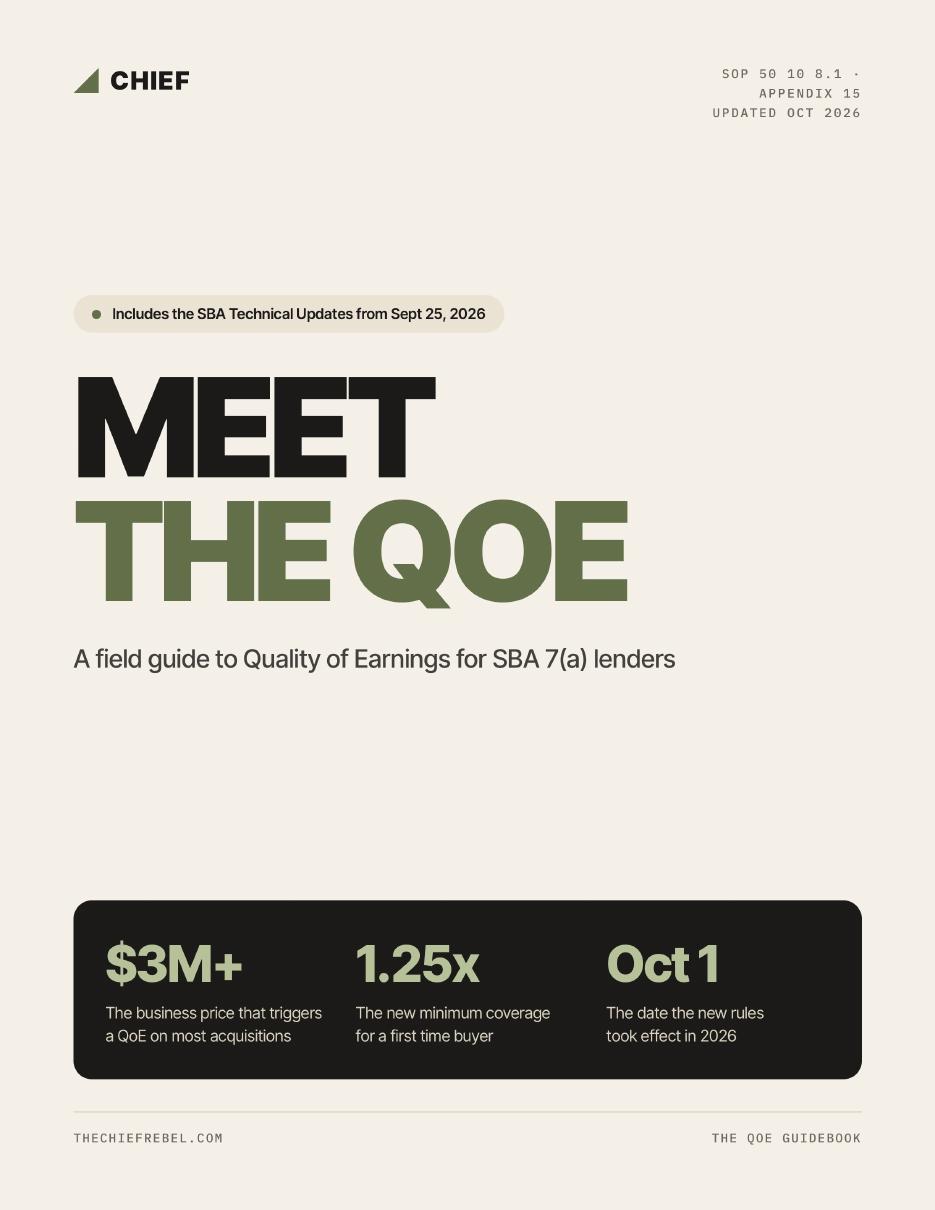
Lender field guide
Meet the QoE
What SBA acquisition lenders should know about Quality of Earnings.
Quality of Earnings
Know which add-backs actually hold up.
Chief starts with reported earnings, traces adjustments to source evidence, tests what's supportable, and gives the lender a normalized earnings base for valuation and credit analysis.
- 01Start with reported earnings
Start with what the financials say.
- Bring the borrower financials together
- Reconcile reported earnings
- Establish the starting point for analysis
- 02Test the adjustments
See which addbacks hold up.
- Review owner and one-time expenses
- Trace adjustments back to supporting evidence
- Separate supported adjustments from questionable ones
- 03See normalized cash flow
See what the business can actually support.
- Arrive at normalized earnings
- See the impact of accepted adjustments
- Carry the result into valuation and credit analysis
QUALITY OF EARNINGS
Harbor Manufacturing Co.
- Industry
- Metal fabrication
- TTM revenue
- $9.4M
- Periods
- FY24 · FY25 · TTM
TTM revenue
$9.4M
Reported EBITDA
$615K
EBITDA margin
6.5%
Operating cash flow
$538K
| Historical performance | FY 2024 | FY 2025 | TTM Jul 2026 |
|---|---|---|---|
| RevenueTax return · P&L | $8.1M | $8.9M | $9.4M |
| Gross profitP&L | $2.44M | $2.58M | $2.63M |
| Operating incomeP&L | $496K | $470K | $441K |
| EBITDAP&L · GL | $688K | $652K | $615K |
| Net incomeTax return | $362K | $331K | $298K |
REPORTED EBITDA · STARTING POINT
$615K
Reconciled to the FY 2025 tax return and TTM interim statements.
ADJUSTMENT REVIEW · TTM JUL 2026
Reported EBITDA $615K
| Owner compensationOwner-related · 2025 general ledger | SUPPORTED | +$120K |
| One-time legal expenseNon-recurring · Legal invoices | SUPPORTED | +$45K |
| Related-party rentRelated party · Lease agreement | SUPPORTED | +$35K |
| Non-recurring revenueRevenue quality · Sales ledger | SUPPORTED | −$22K |
| Vehicle expenseOwner-related · Bank statements | PARTIALLY SUPPORTED | +$18K |
| “Growth investment”Proposed addback · Management explanation | EXCLUDED | +$0K |
EVIDENCE
Owner compensation
- Borrower proposed
- +$120K
- Chief supported
- +$120K
- Status
- SUPPORTED
- Period
- TTM Jul 2026
SOURCE
ANALYST NOTE
Seller salary above the cost of a market-rate replacement GM.
Market replacement cost documented. Full amount supported.
Every adjustment is reviewed against source documents before it counts.
REPORTED EBITDA
$615K
SUPPORTED ADJUSTMENTS
+$196K
NORMALIZED EBITDA
$811K
EBITDA BRIDGE
Every adjustment changes the picture.
NORMALIZED CASH FLOW
Normalized EBITDA
$811K
Annual debt service
$605K
DSCR
1.34x
Debt / EBITDA
4.4x
Valuation earnings base $811K · indicated value $4.78M at 5.9x
NORMALIZED EBITDA
$811K
VALUATION INPUT
$811K
Valuation
Does the purchase price hold up?
Chief connects normalized earnings to a defensible valuation conclusion so the lender can see how performance, purchase price, financing structure, and value relate.
- 01Find the real earnings
Start with what the business really earns.
- Bring the financials together
- Find one-time and owner-related expenses
- Turn reported earnings into normalized earnings
- 02See what it's worth
See what the business is worth.
- Use more than one valuation method
- See the range, not just a single number
- Understand what supports the conclusion
- 03Test the purchase price
See whether the price holds up.
- Compare purchase price to concluded value
- See how the deal is financed
- Check coverage on normalized earnings
BUSINESS VALUATION
Harbor Manufacturing Co.
- Industry
- Metal fabrication
- TTM revenue
- $9.4M
REPORTED EBITDA
$615K
ADJUSTED EBITDA
$0K
$615K + $0K normalization adjustments
NORMALIZATION ADJUSTMENTS
| Owner compensation | +$120K |
| One-time legal expense | +$45K |
| Related-party rent | +$35K |
| Non-recurring revenue | −$22K |
| Vehicle expense (partial) | +$18K |
| “Growth investment” (excluded) | +$0K |
| Total adjustments | +$0K |
NORMALIZED EARNINGS DISTRIBUTION
VALUATION METHODS
- Income approachDiscounted cash flow$4.7M
- Market approachGuideline public companies$5.0M
- Comps approach17 private transactions$4.8M
ESTIMATED BUSINESS VALUE
···
Enterprise value · Normalized EBITDA $811K × 5.9x
PURCHASE PRICE
$5.1M
CONCLUDED VALUE
$4.8M
Price is 6.3% above concluded value
Inside the $4.5M to $5.2M range, near the top.
SOURCES OF FUNDS
- Senior loan$3.6M
- Seller note$580K
- Buyer equity injection$920K
- DSCR on $811K normalized···
Annual debt service $605K. Total sources $5.1M = purchase price.
What the lender gets
One acquisition file. One defensible baseline.
Chief organizes the original credit thesis into a structured record, not a stack of attachments.
As underwritten
Harbor Manufacturing Co.
- Historical financials01
- Normalized earnings02
- Valuation03
- QoE adjustments04
- Buyer profile05
- Purchase price06
- Sources & uses07
- Equity injection08
- Seller financing09
- Debt service coverage10
- Working capital11
- Key risks12
- Source evidence13
The bridge
Bring the credit analysis to life. Grow deposits. Give the banker a reason to call.
Most valuation and QoE work ends as a PDF that nobody opens again. Chief keeps what the bank knew at approval, then keeps watching after close. When a business changes, the banker sees it with the original numbers right beside it.
At underwriting
- Historical financials
- Normalized earnings
- Valuation
- Transaction structure
- Buyer profile
- Original risks
- Approved DSCR
- Supporting evidence
After close
- Current financials
- Actual cash flow
- Updated DSCR
- Material changes
- Variance from original assumptions
- Source evidence
As underwritten
Locked at approval
$811K
Normalized EBITDA
$4.8M
Business value
1.34x
DSCR
The original thesis, adjustments and evidence, preserved as approved.
The same intelligence helps the bank act early, meet SBA servicing and liquidation requirements, and win new business.
Catch problems early
Know when a business has moved away from what was underwritten. Problems are much cheaper to fix in year one than year four, and the evidence is already in the file.
- Revenue decline
- Margin compression
- DSCR deterioration
- Customer concentration
- Working-capital pressure
- New debt
Find the next opportunity
Know when a business is growing, hiring, buying equipment, adding locations, or planning another acquisition. Each of those is a deposit, a loan, or a service the bank can win.
- Revenue growth
- AR growth
- Cash accumulation
- Payroll growth
- Equipment purchases
- New locations
- Additional acquisitions
Email alert · Illustrative example
From: Chief Intelligence
To: BDO, Business Banking
Subject: Harbor Manufacturing has grown since close
Harbor Manufacturing closed in March 2025 on a $3.6M SBA 7(a) loan. Post-close financials now show revenue and cash balances up since the deal closed. The underwriting baseline is on file, so this compares against the same numbers used at close. Cash building like this may point to a treasury management conversation.
Source: post-close financials · Living Credit Record on file
Text message · Illustrative example
Chief Intelligence
Today 9:14 AM
Delivered
The banker decides whether to reach out.
No flood of alerts. A banker with 300 business clients gets one message about one business, and only when something important has changed.
Works with your process
Start with the file you're already working on.
Chief adds intelligence without asking the lender to replace anything it already runs. One analysis comes back two ways: the PDF for the credit file, and structured data when the institution is ready for it.
Bring your own valuation or QoE
Existing third-party valuation, QoE, credit memo, financial statements, projections, and transaction documents can be used to establish the original underwriting baseline.
Lenders don't have to change valuation providers to use Chief.
Who uses Chief
Built for the people responsible for an acquisition loan.
Head of SBA
Standardize acquisition diligence while keeping production moving.
Credit
See normalized earnings, valuation conclusions, assumptions, and supporting evidence.
BDO / Relationship manager
Win the acquisition loan with clearer diligence, then keep visibility into changes that may create the next relationship opportunity.
Portfolio / Special assets
Retain the original underwriting thesis when the loan moves beyond origination.
Innovation / Strategy
Add a high-value intelligence layer without beginning with a core-system replacement.
Start small
Start with one file.
01
Send the acquisition file
- Financial statements
- Tax returns
- Purchase agreement
- Existing valuation/QoE if applicable
02
Chief builds the analysis
- Normalized earnings
- Valuation
- QoE
- Source-linked findings
03
The lender gets a defensible baseline
- Analysis ready for underwriting
- Preserved for future comparison
After closing
Every later review starts from the same baseline.
The lender underwrites the deal, Chief records what the numbers said at closing, and every later period is measured against that record. When something moves, the lender sees whether it creates risk or an opening to grow the relationship.
Underwrite
Valuation and quality of earnings on the deal, before the loan is approved.
Establish the baseline
The report becomes the Living Credit Record, a record of what the numbers said when the loan closed.
See what changes
Later periods are compared to the baseline from the borrower's own data. Chief surfaces both early risk signals and relationship-growth opportunities. The lender decides what action, if any, to take.